
El France 40 Index experimentó un movimiento excepcional
Para aquellos de ustedes que no creen en las tendencias, esta puede ser una oportunidad para aprovechar un excepcional movimiento de un 2,01% en France 40 Index. Este movimiento ha ocurrido durante los últimos 4 horas. Por otro lado, para aquellos que siguen las tendencias, deben considerar aprovecharse de esta.

El France 40 Index experimentó un movimiento excepcional
Para aquellos de ustedes que no creen en las tendencias, esta puede ser una oportunidad para aprovechar un excepcional movimiento de un 2,68% en France 40 Index. Este movimiento ha ocurrido durante los últimos 2 días. Por otro lado, para aquellos que siguen las tendencias, deben considerar aprovecharse de esta.
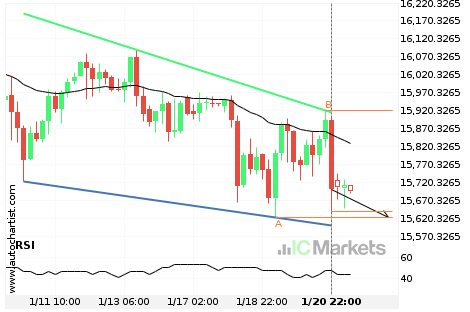
Germany 30 Index – acercándose a el soporte del Cuña descendente
El Germany 30 Index avanza hacia una línea de soporte. Como le hemos visto retroceder desde esta línea anteriormente, podríamos presenciar, o bien, una ruptura a través de esta línea o una recuperación a los niveles actuales. Ha llegado a esta línea en numerosas ocasiones en los últimos 11 días y puede probarla de nuevo […]
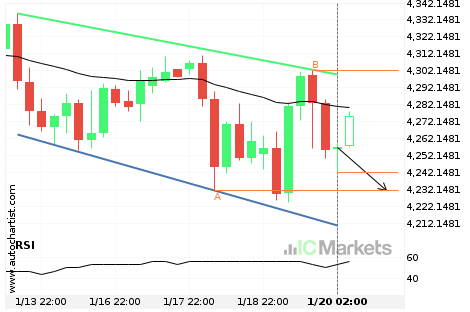
Posible ruptura del nivel de soporte en el EU Stocks 50 Index
El EU Stocks 50 Index avanza hacia la línea de soporte de un Bandera, que ya ha probado varias veces en el pasado. Hemos visto un retroceso antes desde esta línea, así que en esta etapa no está claro si atravesará esta línea o se recuperará como lo ha hecho anteriormente. Si el EU Stocks […]

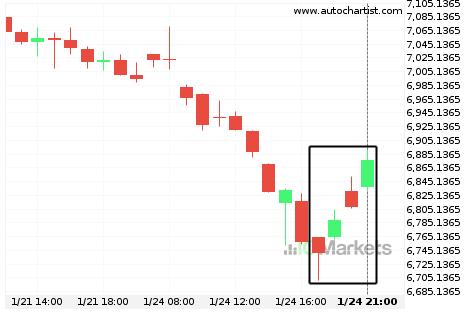
¿Hacia dónde se dirige el Japan 225 Index?
Un movimiento de un 4,07% en 2 días de Japan 225 Index no pasa desapercibido. Puede empezar a considerar hacía donde se dirigirá ahora: si seguirá con la tendencia descendente actual o volverá a la dirección anterior.

Posible ruptura del nivel de soporte en el Japan 225 Index
El Japan 225 Index avanza hacia la línea de soporte de un Triángulo descendiente, que ya ha probado varias veces en el pasado. Hemos visto un retroceso antes desde esta línea, así que en esta etapa no está claro si atravesará esta línea o se recuperará como lo ha hecho anteriormente. Si el Japan 225 […]
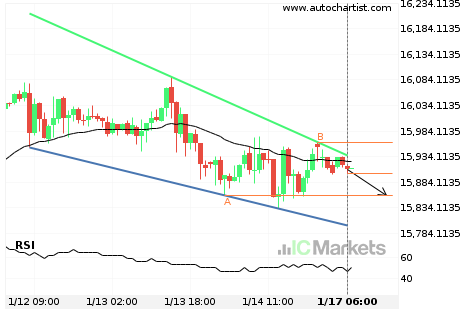
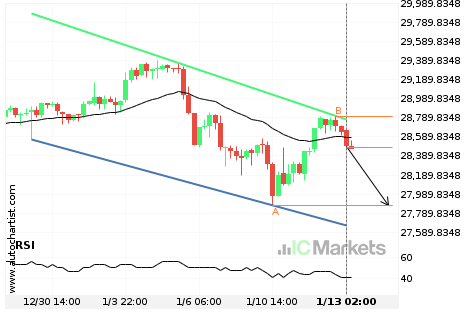
Posible ruptura del nivel de soporte en el Germany 30 Index
El Germany 30 Index avanza hacia la línea de soporte de un Cuña descendente, que ya ha probado varias veces en el pasado. Hemos visto un retroceso antes desde esta línea, así que en esta etapa no está claro si atravesará esta línea o se recuperará como lo ha hecho anteriormente. Si el Germany 30 […]
¿Deberíamos esperar una ruptura o una recuperación del Japan 225 Index?
El movimiento del Japan 225 Index hacia la línea de soporte de un Canal bajista es otra prueba más de la línea que ha alcanzado en numerosas ocasiones durante el pasado. Esta prueba de la línea podría ocurrir en las próximas 4 días, pero no sabemos si dará como resultado una ruptura a través de […]
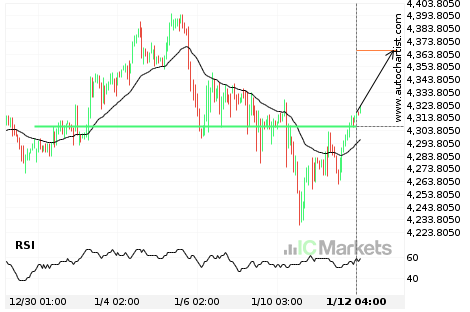
El EU Stocks 50 Index atravesó la importante línea de precio de 4306.6001
El EU Stocks 50 Index atravesó una línea de resistencia. Ha entrado en contacto con esta línea en numerosas ocasiones en los últimos 14 días. Esta irrupción muestra un movimiento potencial hacia el nivel de 4366.8198 dentro de las próximas 2 días. Ya hemos observado un retroceso desde esta posición en el pasado, por tanto, […]